
One thing NBA fanalysts love to do, is break the game up into parts. Who's the best defender, shot blocker, passer, or scorer, are all questions bandied back and forth, as the more boring question of who the best player/team is, is shunted to the side. I generally agree with this popular sentiment, and as such, set out to rank the best scorers of the 2013 season.
To do this, I employed a variation of Dre's Net Points, a formula that determines scoring prowess by subtracting field-goal/free-throw attempts from point totals, to determine the "net" amount of points a player contributed, through scoring alone.
I tweaked this a bit, essentially in the spirit of Rosenbaum's Alternate Win Score. I treated all made field-goals/free-throws as "lost/used" possessions (-1), but gave missed field-goals a value of -.72, and missed free-throws a value of -.86, to reflect the possibilities of an Offensive Rebound. The value for missed free-throws was determined by using NBAWOWY to calculate the ORB% on missed free-throws. The value for missed field-goals was simply derived from the league average ORB% rate, though adjusted a bit higher, to compensate for the already counted and lower free-throw ORB%.
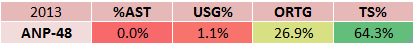
The next step was to account for assisted-shots. Assists are nebulous, and their effect on shooting-percentages is somewhat controversial. However, after reading a post on Vantage about a 10% increase in FG% for "open" shots, I felt comfortable deducting about .2 points (10%FG) from every assisted shot made. The following is a "correlation table". Observe the legend.
ANP-48 = Alternate Net Points per 48 minutes
%AST = Percentage of Player's Shots that were Assisted
USG% = Percentage of a Teams Possessions a Player Used
ORTG = Points Produced by a Player per 100 Possessions
TS% = A Player's Raw Shooting Efficiency
To do this, I employed a variation of Dre's Net Points, a formula that determines scoring prowess by subtracting field-goal/free-throw attempts from point totals, to determine the "net" amount of points a player contributed, through scoring alone.
I tweaked this a bit, essentially in the spirit of Rosenbaum's Alternate Win Score. I treated all made field-goals/free-throws as "lost/used" possessions (-1), but gave missed field-goals a value of -.72, and missed free-throws a value of -.86, to reflect the possibilities of an Offensive Rebound. The value for missed free-throws was determined by using NBAWOWY to calculate the ORB% on missed free-throws. The value for missed field-goals was simply derived from the league average ORB% rate, though adjusted a bit higher, to compensate for the already counted and lower free-throw ORB%.
The next step was to account for assisted-shots. Assists are nebulous, and their effect on shooting-percentages is somewhat controversial. However, after reading a post on Vantage about a 10% increase in FG% for "open" shots, I felt comfortable deducting about .2 points (10%FG) from every assisted shot made. The following is a "correlation table". Observe the legend.
ANP-48 = Alternate Net Points per 48 minutes
%AST = Percentage of Player's Shots that were Assisted
USG% = Percentage of a Teams Possessions a Player Used
ORTG = Points Produced by a Player per 100 Possessions
TS% = A Player's Raw Shooting Efficiency
Next is a table ranking the Top-30 Scorers of 2013, in terms of Alternate Net Points Per Game (ANP-PG).
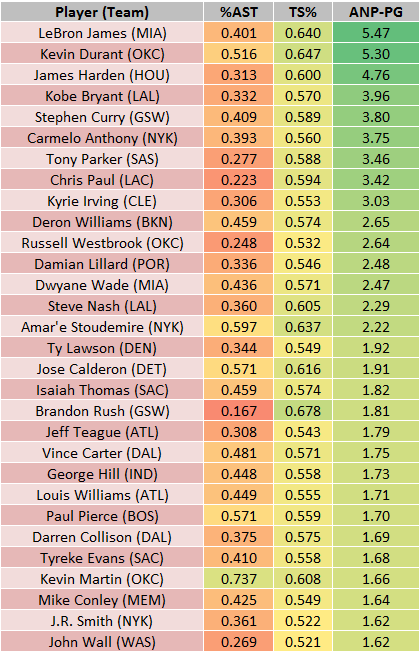
- The only non-perimeter player in the Top-30 was Stoudemire. This kind of makes sense, as big-men primarily contribute through rebounding and defense, not direct scoring.
- TS% has the largest correlation with Alternate Net Points, and none of the Top-30 scorers have a TS% less then 52%.
- %AST and USG% don't seem to have a significant impact on a player's Alternate Net Points rating, at least on the surface.
That's all for now. Keep in mind these values reflect scoring prowess relative to the league-average in 2013. We could also tabulate these relative to team-averages, thereby determining the most "valuable" scorers as opposed to the "best" scorers.
* All values are pace-adjusted, and yes, I did use the .44 free-throw multiplier during calculations. Special thanks to NBA.com's awesome stats.
