
This post, and hopefully future ones, will focus on measuring "skilled" rebounding at the team level. This will be done by isolating and removing the effect that shot locations have on rebounding rates, which ideally, should leave us with a measure of each team's rebounding "skill".
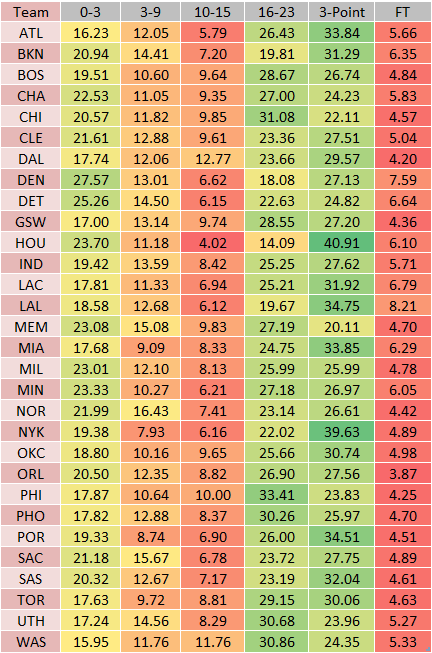
The first step in this process was to pull shot location data for each team, from Hoopdata. I then calculated the percentage of each team's missed shots for each of the 6 major shot locations. This includes misses for free-throws, which were tabulated using team FT% and the .44 multiplier. An example of this data is shown below.
The first step in this process was to pull shot location data for each team, from Hoopdata. I then calculated the percentage of each team's missed shots for each of the 6 major shot locations. This includes misses for free-throws, which were tabulated using team FT% and the .44 multiplier. An example of this data is shown below.
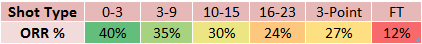
Next, I determined the league average offensive rebounding rate for each major shot location shown above. This was done by looking at the above Grantland chart, this Count the Basket chart, and using NBAWOWY to look at rebound rates of missed 3-pointers and Free-Throws. The tentative values are displayed below.
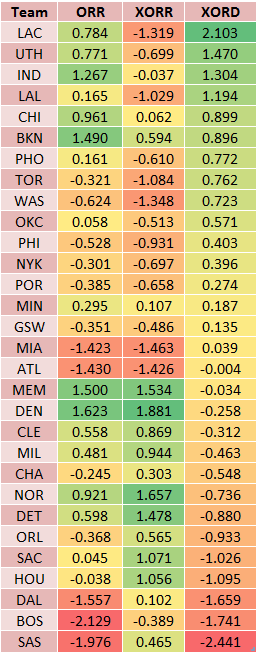
The expected Offensive Rebounding Rate was multiplied by the percentage of each team's misses by shot location, summed, and standardized. I then subtracted this number from each team's actual Offensive Rebounding Rate (standardized), to arrive at a "skilled" rebounding values.
This process is essentially Actual Rebounds (ORR) minus Expected Rebounds (XORR), equals Skilled Rebounding (XORD).
ORR=Offensive Rebounding Rate
XORR=Expected Offensive Rebounding Rate
XORD=Expected Offensive Rebounding Difference
This process is essentially Actual Rebounds (ORR) minus Expected Rebounds (XORR), equals Skilled Rebounding (XORD).
ORR=Offensive Rebounding Rate
XORR=Expected Offensive Rebounding Rate
XORD=Expected Offensive Rebounding Difference
- Normal ORR had a -.487% correlation with wins in the 2013 season. The calculated XORR had a -3.79% correlation. The "skilled" XORD had a +1.48% correlation.
- The Nuggets were the best Offensive Rebounding team in the league during the 2013 Regular Season, but based on where they took their shots from, they were actually a below-average rebounding team.
- Atlanta and Miami are two teams who were ranked quite low in traditional Offensive Rebounding Rate (ORR), but actually seemed to rebound at a league-average rate, based on where they took their shots.
That's all for now. I plan on doing Defensive Rebounding once I monkey around with the weights a little more, just to make the results as tight as possible.
