This is the next part of my rebounding vs. shot locations study, with this post covering offensive rebounds. For those interested in the raw data I was using, I will be posting that in a separate area on the website.
I charted and regressed each teams misses from the paint and mid-range, with their respective offensive rebounding rates, to determine how strong the correlation is between these two variables. Since I knew the process, this study was much easier then the defensive rebounding one, and I quickly arrived at a value of 17%. When adjusting for exact shot locations expressed in the chart, (see first post) but unavailable in data form, we can say roughly 20% of offensive rebounds are due to shot locations alone.
This is roughly 10% lower then the defensive rebounding value, suggesting the old mantra regarding offensive rebounds is true. They are worth more, because they are "shared" less then defensive rebounds, have less to do with shot locations, and more to do with "skill".
Once again, I have a nice little table showing which teams are under/over rebounding based on their shot selections, which I attribute mostly to skill.
It goes from most to least skilled.
Red=skilled, Yellow=average, Blue=below average.
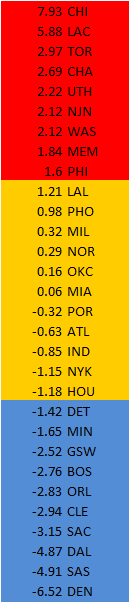
It really can't be understated just how amazing the Bulls are at offensive rebounding. Based on their shot locations, they should have been slightly under average, but instead led the league in offensive rebounding rate.
Toronto seems to have some of the best rebounders in the league, but the system they play in severely mitigates their rebounding numbers.
Cleveland, Sacramento, and Denver are really underachieving when it comes to offensive rebounds, which is surprising since they have what many consider to be "great rebounders".
That's all folks. There is still plenty to be done on this subject, some of which I intend to do immediately. As mentioned earlier, I will be posting my data as soon as I can put it all in one place (its currently spread across 3 computers in 6 different Excel files).
