I ran through the data for the 2010-2011 NBA season, and did my usual rebounding work regarding shot locations and skill. Here are the highlights of the study.
I once again regressed missed shots (0-9 feet and 16-23 feet), against defensive rebounding rates for each team, and came up with an R2 of 31.8. Therefore, we can say that in 2010-2011, 31.8% of defensive rebounds were collected based on where they were shot from. This is a large increase from the 22.3% correlation value obtained for the 2011-2012 season.
The same was done for offensive rebounding rates, with a correlation value of 11.4% representing the 2010-2011 season. This is a significant decrease from the 2011-2012 value of 17.4%.
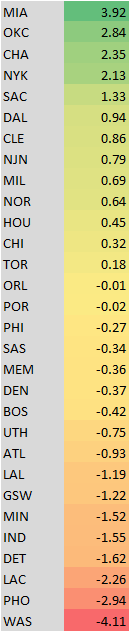
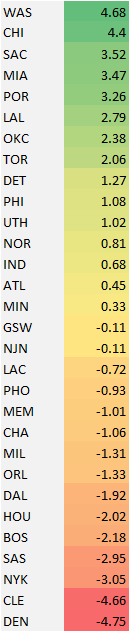
And finally, here are the tables depicting which teams were under/over rebounding based on their respective shot locations. Remember, these values are obtained by subtracting the net amount of misses from the net rebounding rates. Essentially, this is what we are doing.
Output-System=Skill
The teams are ordered from most to least skilled rebounders. Greener positive numbers are skilled, red negative numbers aren't.
I once again regressed missed shots (0-9 feet and 16-23 feet), against defensive rebounding rates for each team, and came up with an R2 of 31.8. Therefore, we can say that in 2010-2011, 31.8% of defensive rebounds were collected based on where they were shot from. This is a large increase from the 22.3% correlation value obtained for the 2011-2012 season.
The same was done for offensive rebounding rates, with a correlation value of 11.4% representing the 2010-2011 season. This is a significant decrease from the 2011-2012 value of 17.4%.
And finally, here are the tables depicting which teams were under/over rebounding based on their respective shot locations. Remember, these values are obtained by subtracting the net amount of misses from the net rebounding rates. Essentially, this is what we are doing.
Output-System=Skill
The teams are ordered from most to least skilled rebounders. Greener positive numbers are skilled, red negative numbers aren't.
Defensive Rebounding Skill by Team (10-11)
Offensive Rebounding Skill by Team (10-11)
The Heat were just about the best rebounding team in the league in 2010-2011, in terms of skill. According to my earlier charts, they fell to slightly above average in 2011-2012. The reason for this drastic drop? My best guess would be small ball.
Dallas, the team that won the title, was a mediocre rebounding team in terms of skill. Not sure what that means, but there it is.
That's all folks. I'll probably do these studies all the way back until the 06 season, at which point the data runs out. This should give us a better idea of how much rebounding rates have to do with shot locations, and which teams were under/over rebounding. I'll also be rolling out skill tables for the 2012-2013 season around the all star break, to see where each team stands in relation to previous years.
