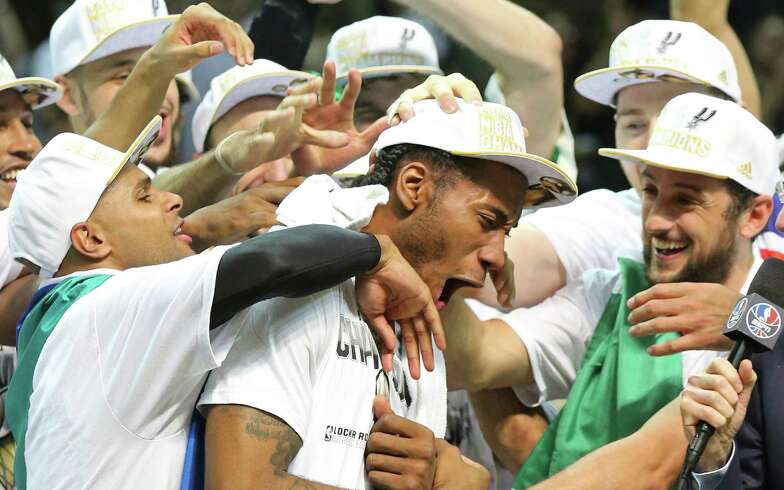
The San Antonio Spurs won the 2014 NBA Championship, my beloved Miami Heat lost, and I feel sad. That said, this Spurs team was clearly in a class of its own, and I just couldn't help but smile as the Pop/Timmy/Manu/Tony quartet hoisted another trophy. The young Kawhi Leonard also hoisted some hardware this past weekend, specifically, the Finals MVP trophy. Therefore, its only proper that I use my HDR (RAPM-SPM) metric to see if this accolade was deserved, and how Kawhi's Finals performance ranked historically.
As you may (or may not) have known, Kawhi Leonard is the third youngest Finals MVP in history. He also won this prestigious award on Father's Day, six years after his father was shot and killed. Oh, and Kevin Durant thinks Leonard's success is a little overrated (he's actually right). Okay, now that I got niceties out of the way, let's see some numbers.
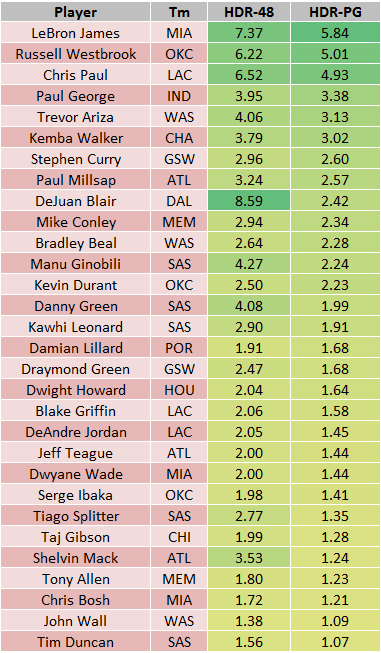
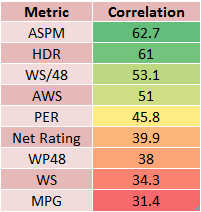
If you need a review of my HDR, click the orange link in the first paragraph. Just know that its better then pretty much any box-score metric out there, except for similar derivatives like ASPM and Estimated Impact. Players are ranked by per-game production (HDR-PG), with their per-minute numbers listed on the left (HDR-48).
As you may (or may not) have known, Kawhi Leonard is the third youngest Finals MVP in history. He also won this prestigious award on Father's Day, six years after his father was shot and killed. Oh, and Kevin Durant thinks Leonard's success is a little overrated (he's actually right). Okay, now that I got niceties out of the way, let's see some numbers.
If you need a review of my HDR, click the orange link in the first paragraph. Just know that its better then pretty much any box-score metric out there, except for similar derivatives like ASPM and Estimated Impact. Players are ranked by per-game production (HDR-PG), with their per-minute numbers listed on the left (HDR-48).
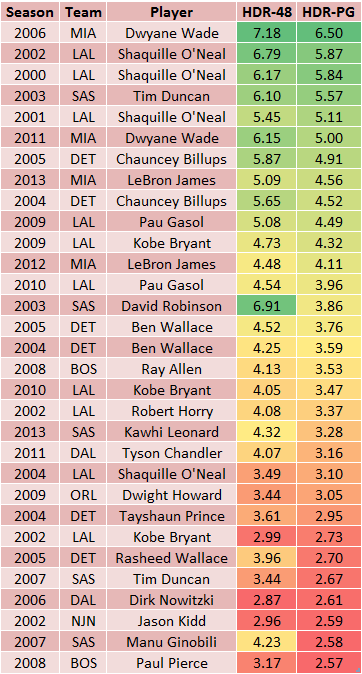
Top 30 NBA Finals Performances (2000-2014)
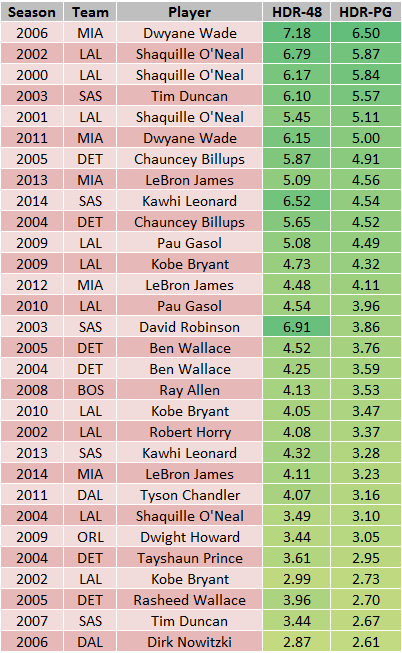
As depicted by the table above, Kawhi was awesome this year. His per-game production ranks 9th, while his per-minute rating ranks 4th. Leonard clearly deserved Finals MVP, and though his numbers may look relatively pedestrian at first glance, his overall impact was tremendous.
- LeBron didn't rate too badly either, ranking 22nd in per-game production. Its a shame his team was so terrible.
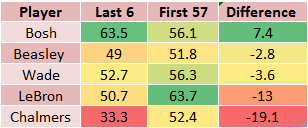
- Dwyane Wade and Norris Cole each had a rating of -2.1 per game this Finals, ranking in the bottom five (along with 2005 Tony Parker) of qualified Finals performances since 2000.
At some point in my life before I die (knock on wood), I will log the Finals Ratings for the 1980-1990 seasons.
- LeBron didn't rate too badly either, ranking 22nd in per-game production. Its a shame his team was so terrible.
- Dwyane Wade and Norris Cole each had a rating of -2.1 per game this Finals, ranking in the bottom five (along with 2005 Tony Parker) of qualified Finals performances since 2000.
At some point in my life before I die (knock on wood), I will log the Finals Ratings for the 1980-1990 seasons.